![]()
BioXing™
Solutions for Biotechnology
![]()
![]()
![]()
![]()
![]()
![]()
![]()
![]()
|
BioXing™ Solutions for Biotechnology
|
|
|
Data Plot is available from the Microsoft Windows Store at the following link: http://apps.microsoft.com/windows/app/data-plot/bb37aa3d-82cc-442d-b26e-5eba9447aff6 Data Plot is a general purpose Windows Store App plotting application that supports Line Plots, Bar Charts and Pie Charts and displays of user parameterized functions. Data can be entered manually, loaded from text files and the clipboard with tab, comma, semicolon and space delimited fields and with fixed width columns, saved DataPlot formatted XML files or from one of the available parameterizable internal standard math and geometric shape functions. In addition user defined functions can be entered and evaluated using their parameters to create a dataset. In addition user defined functions can be entered and evaluated using their
parameters to create a dataset of X,Y values. For example: One to ten
datasets of X,Y values can be plotted simultaneously in an overlapped graph or
in individual graphs. A collection of X,Y values can not only represent data but
they can be used to render shapes such as polygons, roses and spirals that are
generated from geometric shape functions. Since plots of datasets can be
overlapped, sets of mathematical shapes can be used in innovative ways to create
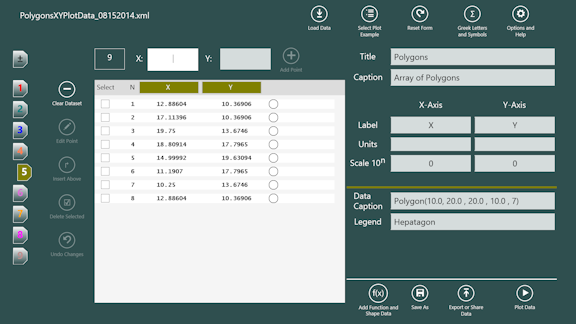
objects that begin to show the power of mathematics in graphics. Data Entry View for 9 datasets containing polygons. Each tab represents a dataset, tapping a tab shows the set of X,Y values for that dataset. On the right side is the global graph meta data and individual data set metadata.
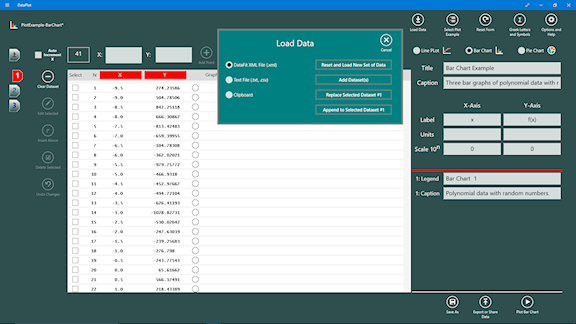
This view shows updated data entry where graph types Line Plot, Bar Chart and Pie Chart can be selected. It also shows the versatile Load Data Popup.
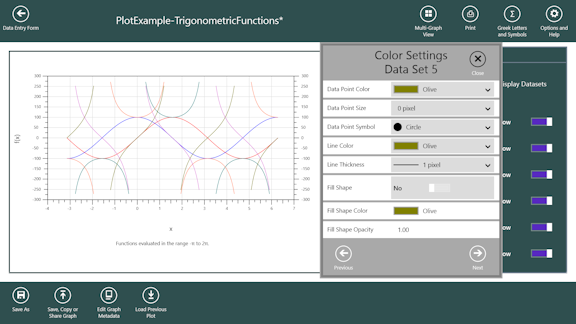
Graph View of trigonometric functions and Color Settings dialog box.
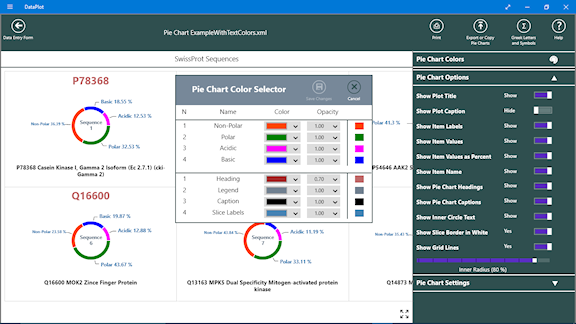
Graph View showing rendering of pie charts and the pie chart color selector popup. Each pie chart if rendered with each slice automatically labeled, a heading and a caption. The pie chart can look like a regular pie chart or as a ring chart with a user settable ring thickness. When a ring is displayed the interior of the ring can contain text.
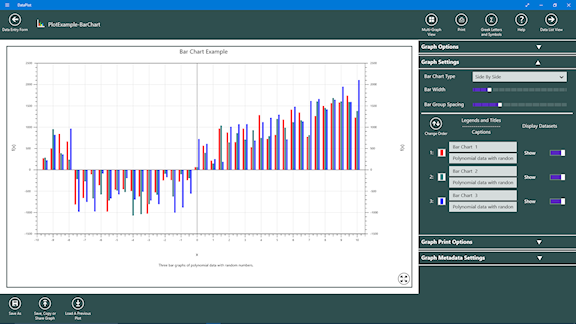
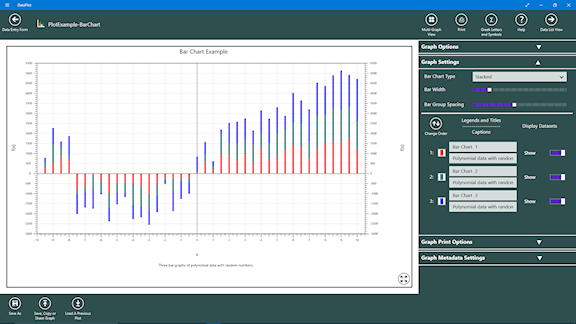
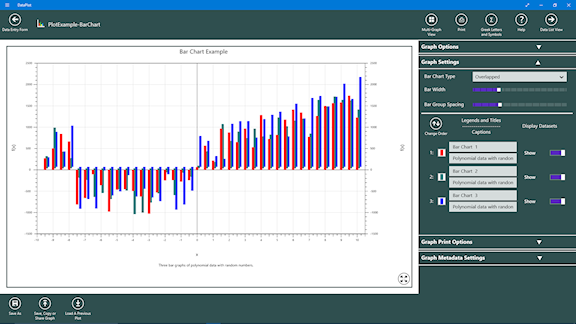
The following are examples of the different bar chart formats. Side by Side format is where the bars for each dataset at a given X-Value are place next to each other as a group centered over the X-Value. The Stacked format is where the bar for each dataset at a given X-Value are placed on top of each other. The Overlapped format is the bar for each dataset at a given X-Value is place to the right and upwards which creates a 3-D look. SIDE-BY-SIDE Format.
STACKED Format
OVERLAPPED Format
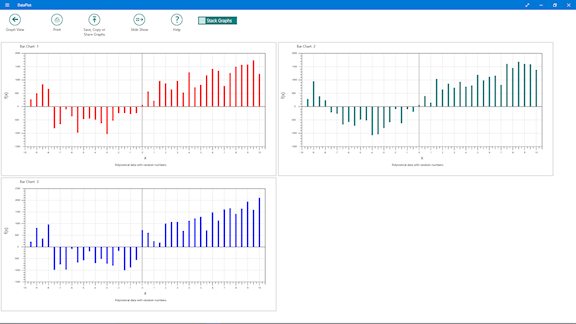
Multi-Graph view is where each dataset is rendered in a separate graph. The view below shows a multi-column and multi-row format. Checking the Stack Graph checkbox will show each graph resized to the width of the application and stacked one on top the other.
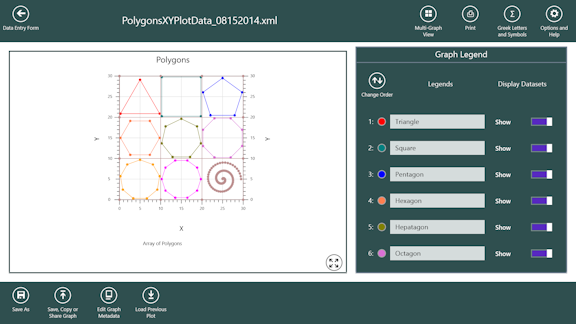
Graph View - Overlapped plot of 9 Datasets where each dataset is plotted in a definable bounding rectangle and location. Graph Legend panel allows showing or hiding of individual datasets and making color settings per dataset. See Color Settings Dialog below.
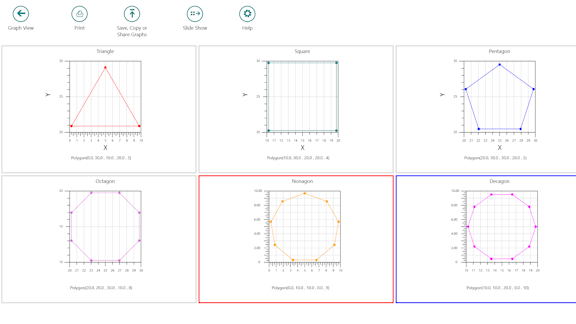
Multi-Graph View - Individual plots of polygon datasets. Red rectangle indicates selected and blue rectangle indicates where cursor or pen is currently over.
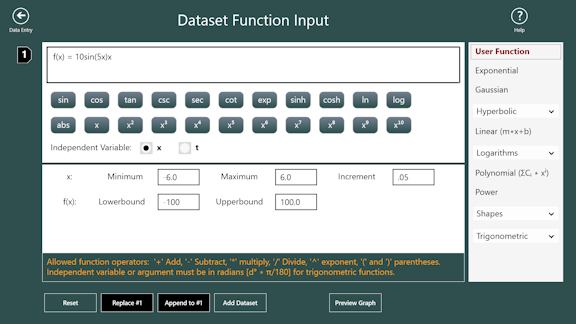
User function input view shows the function entry window with an equation using implied multiplication f(x) = 10sin(5x)x which could also be entered as f(x) = 10*sin(5*x)*x. Below the window are two rows of buttons which when tapped will place the function at the position of the cursor in the function entry window. There are two radio buttons that are used to select whether the independent variable is x or t. Further below are parameter entry boxes which are used to calculate the dataset of X,Y values using the entered function.
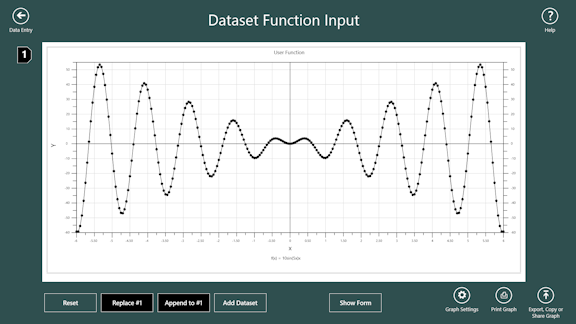
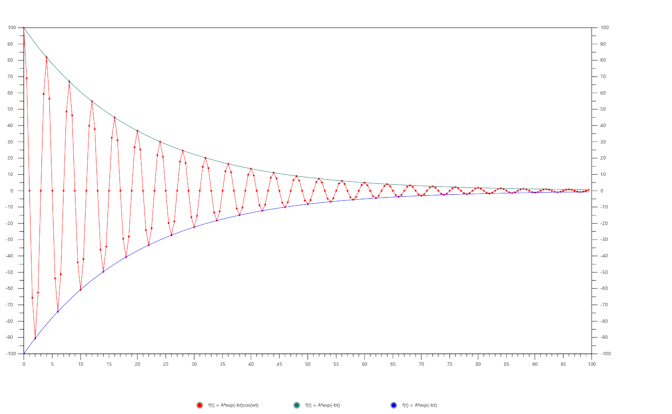
The following is a graph of the calculated dataset using the entered function and parameters in the above view.
Shared or Copied graph of Decaying Cosine Function.
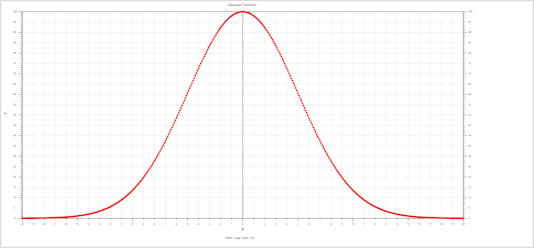
Gaussian
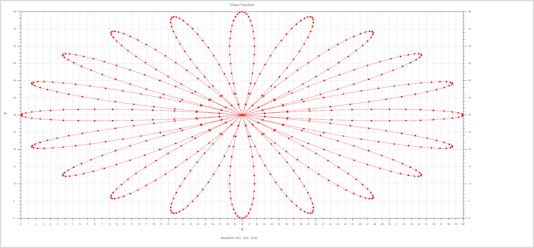
Rose with 10 petals
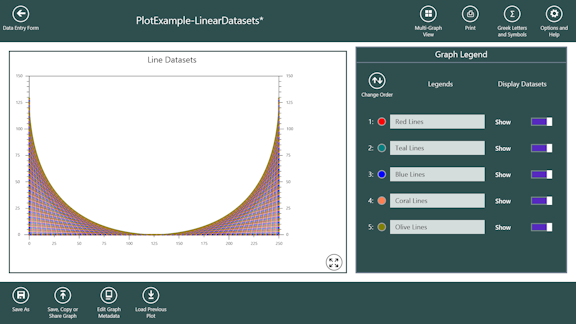
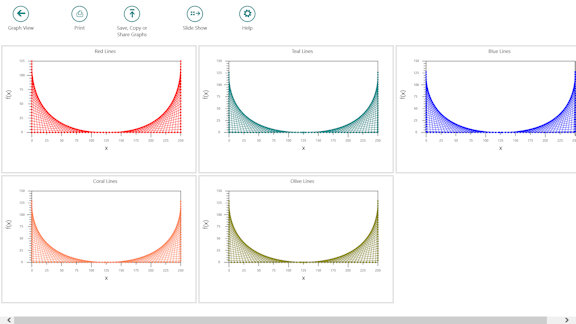
Graph View - Colored Lines with Graph Legend Panel
Multi-Graph View - Individual plots of colored lines.
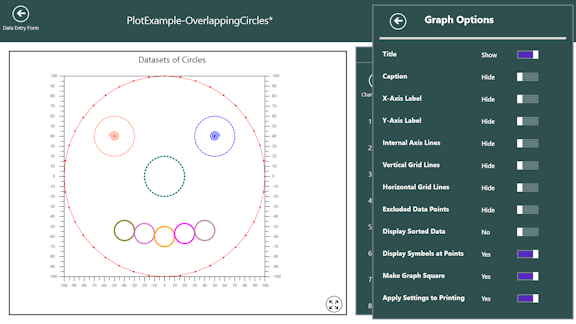
Graph View - Circles and Graph Option Panel
|
|
Send mail to
info@BioXing.com with questions, comments or requests for information.
|