![]()
BioXing™
Solutions for Biotechnology
![]()
![]()
![]()
![]()
![]()
![]()
![]()
![]()
|
BioXing™ Solutions for Biotechnology
|
|
|
This Windows 10 and 8 Store App performs linear least squares regression fitting to
obtain a line of best fit for data. It is designed for scientific and
business small datasets of less than 500 points, but it can handle larger. Currently, the available fitting
functions are Linear, Exponential, Logarithm, Power and Polynomial of order up
to 10. It determines the fit line equation, regression R² value, graphs
the original data with the fit line and lists the original data with
predicted values. Data can be easily entered and edited manually or loaded from
CSV files (tab, space or comma separated x and y values). The original data and results can be saved to an XML file for
reviewing and exporting. The graph of input data with fit line and its fit
equation, R² value and tabular results can be printed. Link to App in Windows Store contains a slide show of screen captures of DataFit that can be viewed with any Web Browser: http://apps.microsoft.com/windows/app/data-fitting/ee048961-8d09-4cf5-8ae9-3d0e76eabd92
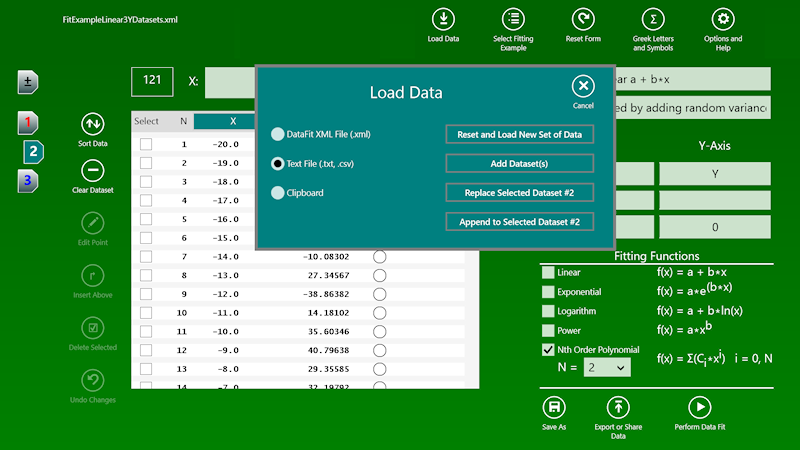
Data Entry view showing 3 datasets, 2nd order polynomial selected, title and caption entered along with labels for the x and y axes. It also shows the load popup view for loading new, additional, replacement or appending data. The popup also shows that the data can come from a previously saved xml DataFit file or from a text file or the clipboard. There are buttons for saving the data or exporting it.
Graph view showing a plot of three datasets with its 2nd order fit line. Toggling on and off a dataset forces a recalculation of the fit line using only the datasets being displayed.
Graph view showing an exponential fit to a set of data.
Graph view showing an log fit to a set of data.
Graph view showing a linear fit to 10 datasets.
Multi-graph view showing each of the above datasets in its own graph with its own fit line.
|
|
Send mail to
info@BioXing.com with questions, comments or requests for information.
|
 Award
received March 1, 2014
Award
received March 1, 2014